AGM API への最初の「ハック」です。
ビジュアルスクリプトのデバッグはすでに煩雑になりそうな予感がしますし、PrintMessageToConsole アクションを追加するのは手間がかかります https://guild.rpgmakerofficial.com/t/topic/197
より良いのは、VisualScriptAction に直接デバッグを有効にするオプションを設けることです。

これは 1.0.6 や 1.0.7 での実装を求めているわけではありません。まだアイデアとして洗練が必要です。ビジュアルスクリプティングで実現可能な他のデバッグ機能についても検討しています。
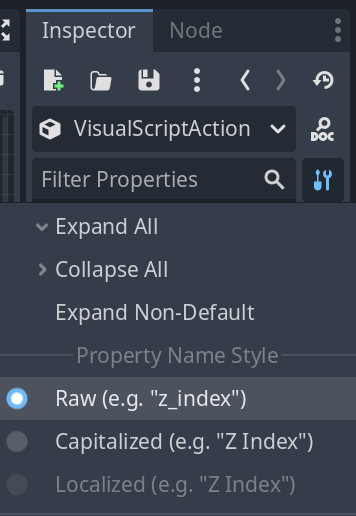
本来はオプションの表示場所を示す画像だけの予定でしたが、ツールコーダーがデモスクリプトを作成してしまいました。
GitHub Gist: Action Game Marker, Visual Script debugging, GDScript tools
元のスクリプト
# debug_vsa.gd
extends VisualScriptAction

@export var print_message_to_console : bool = true :
	set(v):
		if v:
			_add_print_action.call_deferred()
		else:
			_remove_print_action.call_deferred()
		print_message_to_console = v

var _print_action : Actions = PrintMessageToConsole.new()
var _print_action_at_index : int

func _init() -> void:
	_print_action.print_message = visual_script_node_title + " entered"

func _add_print_action() -> void:
	other_actions.append(_print_action)
	_print_action_at_index = other_actions.size() - 1

func _remove_print_action() -> void:
	if  other_actions.size() > 0 and other_actions[_print_action_at_index] == _print_action:
		other_actions.remove_at(_print_action_at_index)
(現在、.gd スクリプトはファイルタイプとしてアップロードできません)
このスクリプトのランタイムにおける _remove_print_action() は未検証です。
Godot スクリプティングに精通した上級者の方向けに、既存の VisualScript (VS) 内の State にこのスクリプトをアタッチする方法を以下に示します。
- FileSystem に
debug_vsa.gdを作成します。 VisualScriptActionを継承している必要があります。そうでない場合は…- 上記のスクリプト全体をコピーします。
- 既存の VS を作成するか、既存のものを使用します。
Initial Stateを選択します。- インスペクターで一番下までスクロールし、‘RefCounted’ ヘッダーまで移動します。
debug_vsa.gdをロード、クイックロード、またはドラッグして割り当てます。

これで「Print Message to Console」のチェック済みブール値が表示されるはずです。テスト実行では、State の名前と「entered」を含む出力メッセージが表示されます。
デバッグにおいて非常に役立つのは、Godot 用の SignalVisualizer プラグインのようなものです。どのリンクや State がトリガーされているかを視覚的に追跡できるようにするためです。
デバッグを超えて、VisualScriptAction や VisualScriptActionLink を拡張しても、実際のビジュアルスクリプトインタプリタへのエントリーポイントが提供されるわけではない点に注意してください。これらは単に AGM が事前に定義された条件チェックを行い、事前にスクリプト化されたコードを実行するために使用する Resource です。
これらにより、カスタム GDScript を介して特定のリンクや State、その Conditions や Actions を簡単に修正できるようになる可能性があります。現在のプロセス安全性については不明な点もあるため、AGM がすべての VS リソースを参照して修正する前に変更を加えることができるよう、_physics_process から call_deferred や set_deferred を使用することを検討してください。